How Price Moves
How Price Moves
In one line: Price does not move in a straight line — it moves in waves, in a repeating cycle of a strong push and a small pullback.
🎯 What you'll learn
- Why price moves in waves, not in a straight line.
- The battle between buyers and sellers that pushes price.
- What an impulse, a correction, and a consolidation are.
- How waves make an uptrend or a downtrend.
📘 Key concepts
Price is a tug-of-war
Think of a bazaar (market). At every moment, buyers and sellers are fighting over one price.
- Buyers (demand — how much people want to buy) push the price up.
- Sellers (supply — how much people want to sell) push the price down.
- When neither side wins, price moves sideways (flat, no clear direction).
The simple flow to remember:
- Buyers (demand) → Price moves (up, down, sideways) → Sellers (supply).
Price moves in waves
Price never goes straight up like a rocket. It moves in small steps, like a person climbing stairs — up, small rest, up again.
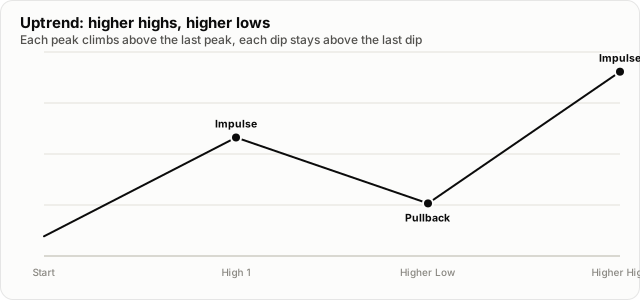
- Impulse (a strong, fast move in the trend's direction) — the big push.
- Correction / Pullback (a slower, smaller move against the impulse) — the small rest.
- One impulse plus one pullback = one wave. Then it repeats.
This repeating up-push and down-rest is why we say price moves in a cycle, not by luck.
Waves build trends
The highs (peaks) and lows (bottoms) of these waves tell you the trend.
- Higher High + Higher Low = Uptrend — each peak is higher, each dip is higher. Price is climbing.
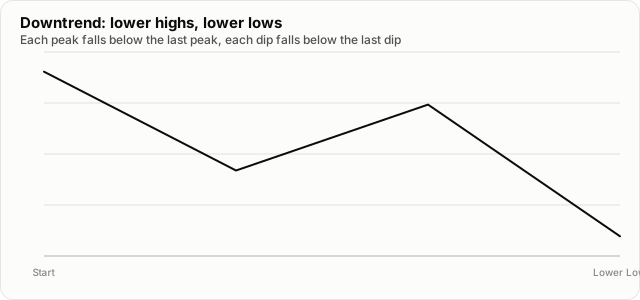
- Lower High + Lower Low = Downtrend — each peak is lower, each dip is lower. Price is falling.
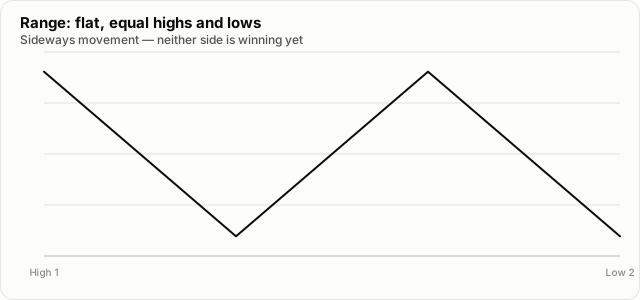
- If highs and lows are flat and equal, price is in a range (sideways).
What drives the waves
Many things push buyers and sellers at once:
- Liquidity (how easily orders get filled) — fuel for the move.
- News and economic data — create sudden volatility (fast, big price swings).
- Market sentiment (the crowd's mood — fear or greed) — changes how people react.
- Technical levels like support (a floor where buyers step in) and resistance (a ceiling where sellers step in).

🔍 Example
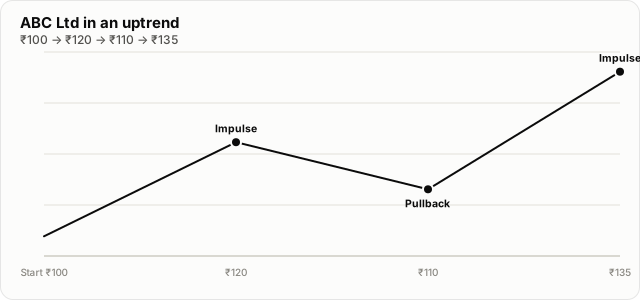
Imagine a share of "ABC Ltd" in an uptrend.
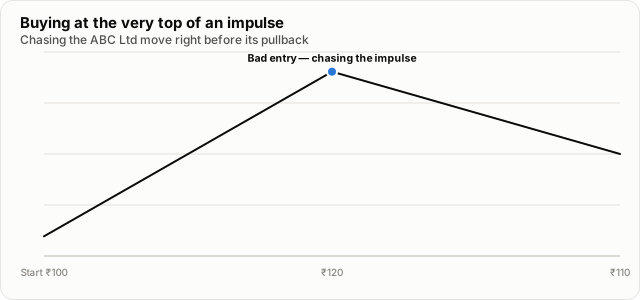
- It rises from ₹100 to ₹120 → this is the impulse (strong push up).
- It dips from ₹120 to ₹110 → this is the pullback (small rest, not a full drop).
- It rises again from ₹110 to ₹135 → next impulse.
Look at the numbers: the high went 120 → 135 (higher high), and the low went 100 → 110 (higher low). That is an uptrend.
The path looks like stairs going up, not a straight line.
⚠️ Common mistakes
- Thinking price will go up in a straight line — it always rests and pulls back.
- Panicking during a normal pullback and selling too early.
- Buying at the very top of an impulse, right before a pullback.
- Believing price moves are random — they follow a cycle of impulse and correction.
- Ignoring the highs and lows, so you miss whether the trend is up or down.
✅ Key takeaways
- Price moves in waves, not in a straight line, and it is not random.
- Each wave = one impulse (strong push) + one correction (small pullback).
- Higher High + Higher Low = uptrend; Lower High + Lower Low = downtrend.
- Buyers push price up, sellers push price down, and both fight all the time.
- Sideways movement (consolidation) builds energy for the next big move.
📝 Quick check
- Q: Does price move in a straight line? A: No. It moves in waves — a strong push (impulse), then a small rest (pullback), again and again.
- Q: What pattern of highs and lows means an uptrend? A: Higher highs and higher lows — each peak and each dip is higher than the last.
- Q: What is a pullback? A: The correction — a smaller move against the trend, between two impulses.
📖 New words
- Demand — how much buyers want to buy; strong demand pushes price up.
- Supply — how much sellers want to sell; strong supply pushes price down.
- Impulse — a strong, fast move in the direction of the trend.
- Correction / Pullback — a slower, smaller move against the impulse.
- Consolidation — sideways movement that builds energy for the next move.
- Higher High — a peak that is higher than the previous peak.
- Higher Low — a dip that is higher than the previous dip.
- Uptrend — price rising, making higher highs and higher lows.
- Downtrend — price falling, making lower highs and lower lows.
- Volatility — how fast and how big price swings are.
- Liquidity — how easily buy and sell orders get filled.
- Support — a price floor where buyers tend to step in.
- Resistance — a price ceiling where sellers tend to step in.
- Market sentiment — the crowd's overall mood, fear or greed.
Educational content only — not financial advice. Trading involves the risk of losing money.